
Key Highlights:
- India’s GDP growth projected to decline from 8.2% in FY2024-25 to 6.3-6.8% in FY2025-26 despite corporate profitability reaching 7% (double the decade average) and bank NPAs falling from 6% to 2.6%
- Corporate investment ratio stuck at 12% of GDP versus 16% peak during 2004-2008 indicating disconnect between ability to invest (restored profitability) and willingness (moderate 6.5% growth outlook vs 8% earlier)
- Current Gross Capital Formation at 30-32% of GDP versus required 35%+ for 8% growth trajectory with ICOR of 4.5 showing India needs fundamental structural reforms beyond financial metrics
- Price-to-Income ratio of 11 in urban India versus affordability benchmark of 5 forcing firms into dispersed growth models that compromise agglomeration economies compared to Beijing/Shanghai ($500-550B GDP vs Mumbai/Delhi $100-150B)
- India’s export intensity remains domestically oriented with 85% revenues from domestic sales versus South Korea (70% domestic, 30% export) indicating competitiveness constraints rather than market saturation limiting global integration
The Growth Paradox Unveiled
India stands at a critical economic crossroads where traditional growth metrics present a puzzling contradiction: corporate profitability has reached record highs, banking sector health has improved dramatically, yet investment remains stubbornly low and GDP growth projections are declining from 8.2% in FY2024-25 to 6.3-6.8% in FY2025-26.
This economic enigma raises fundamental questions about India’s structural growth potential and whether the current slowdown represents a temporary blip or deeper structural challenges that require comprehensive assessment through the investment lens. Capital formation serves as the key indicator of structural growth potential, and India’s current performance suggests significant gaps that threaten the Viksit Bharat @2047 aspirations.
The central challenge lies in understanding why corporations with restored financial health are not translating improved capabilities into higher investment levels. With net profit after tax to sales ratio at 7% – nearly double the decade-long average – and bank NPAs declined to 2.6% from 6%, India Inc. possesses unprecedented capacity for capital expansion.
However, investment function depends on two critical variables: profitability (ability to invest) and growth outlook (willingness to invest). While ability has been restored, moderate growth expectations of 6.5% versus 8% during surge years are dampening “animal spirits” for capacity expansion, creating a vicious cycle where low investment expectations become self-fulfilling prophecies.
This investment paradox becomes crucial for designing next-generation economic reforms that can unlock India’s growth potential and achieve the ambitious targets set for becoming a developed nation by 2047.
Understanding India’s Investment Challenge

Current Investment Reality and Structural Requirements
India’s investment performance reveals significant gaps between current achievements and requirements for sustained high growth:
Investment Metrics Analysis:
- Gross Capital Formation: 30-32% of GDP versus required 35%+ for 8% growth trajectory
- Incremental Capital-Output Ratio (ICOR): 4.5 indicating reasonable capital efficiency
- Corporate investment ratio: 12% of GDP (FY2022-23) compared to 16% peak during 2004-2008 surge years
The ICOR of 4.5 suggests that India needs 4.5 units of additional capital to generate 1 unit of additional output. With current investment rate of 30-32%, this yields trend GDP growth of 6.5-7% annually – insufficient for Viksit Bharat aspirations that require 8%+ sustained growth.
Gap Analysis for Viksit Bharat @2047:
Achieving 8%+ annual growth requires investment rate of 35% or higher of GDP. This translates to additional investment of ₹35-40 lakh crore annually at current GDP levels – a massive scaling challenge that demands comprehensive reforms across all factors of production.
Private Corporate Investment Trends
Corporate sector performance shows clear disconnect between financial capability and investment behavior:
Financial Health Indicators (Record Levels):
- Net profit after tax to sales ratio: 7% in 2023 (double the decade average)
- Bank NPAs: Declined to 2.6% from 6% average in previous decade
- Balance sheets: Stronger than any time since 2008 financial crisis
Investment Sluggishness Despite Restored Profitability:
Corporate investment has remained subdued despite unprecedented improvement in financial health and lending capacity. This paradox indicates that investment decisions are driven more by growth expectations than financial capability alone.
The Twin Paradox: Profitability versus Investment Willingness
Corporate Financial Health at Historic Highs
Indian corporations enjoy financial strength not seen since the pre-2008 period:
Profitability Restoration:
- Return on assets and return on equity have recovered to healthy levels
- Debt-to-equity ratios have improved significantly across major sectors
- Interest coverage ratios provide comfortable buffers for debt servicing
- Cash flow generation enables substantial reinvestment capacity
Banking Sector Recovery:
Commercial banks’ lending capacity has expanded dramatically with NPA resolution, recapitalization, and improved risk management practices. Credit growth to productive sectors faces limited supply-side constraints.
Why Corporates Are Not Investing: The Expectation Problem
Investment function analysis reveals two critical components:
Ability to Invest (Restored):
- Profitability levels enable substantial capital expenditure
- Access to credit at reasonable interest rates
- Cash reserves accumulated during recovery period
Willingness to Invest (Constrained):
- Current growth outlook: 6.5% versus 8% during 2004-2008 surge years
- Moderate demand expectations dampen “animal spirits” for capacity expansion
- Global economic uncertainty affects long-term planning confidence
Key Insight: India Inc. investment levels are consistent with their demand growth assessment, not holding back investment due to capability constraints. The challenge lies in creating conditions that improve growth outlook and justify higher capacity investments.
The Export-Growth Nexus
Historical Export Performance and Growth Correlation
Export performance strongly correlates with GDP growth trends across different periods:
Export Growth Patterns:
- 1994-2004: 13% real export growth corresponding to 6.1% GDP growth
- 2004-2008: 20% export growth enabling 7.9% GDP growth (surge period)
- 2012-2020: 3.5% export growth resulting in 6.6% GDP growth
Post-pandemic recovery has been modest amid global trade fragmentation, supply chain disruptions, and increasing protectionism affecting traditional export markets.
Global Trade Environment Challenges
International trade dynamics present significant headwinds for export-led growth strategies:
Global Trade Projections:
- World export growth: 4% (2005-2020) projected to decline to 3.3% for 2025-26
- Trade wars and tariff increases threatening 0.3 percentage point reduction in global growth
- Supply chain fragmentation affecting traditional trade patterns
Competitive Challenge: India must grow exports significantly faster in a sluggish global environment through enhanced competitiveness rather than riding global trade expansion.
Role of Large Firms in Export Growth: The Competitiveness Gap
Current Export Structure and Global Comparison
Export concentration analysis reveals structural limitations:
Large Firm Dominance:
- Large firms account for 55% of India’s exports versus 40-45% in OECD countries
- MSMEs contribute 45% of total exports but face scale and efficiency constraints
Domestic Market Orientation:
- 85% of Indian firm revenues come from domestic sales
- Limited global penetration compared to successful export economies
International Benchmarks:
Policy Inference: Indian firms’ limited global penetration results from competitiveness constraints, not market saturation, indicating substantial scope for improvement through structural reforms.
Export Competitiveness Enhancement Requirements
India’s $2 trillion export target by 2030 from current $770 billion (FY23) requires fundamental improvements in manufacturing competitiveness: tribuneindia
Technology-Intensive Manufacturing Shift:
Electronics exports have expanded fivefold to $38.5 billion, increasing share from 2% to 9% between FY18 and FY25. Engineering goods, petroleum products, pharmaceuticals, gems and jewellery together account for 70% of merchandise export value.
Global Value Chain Integration:
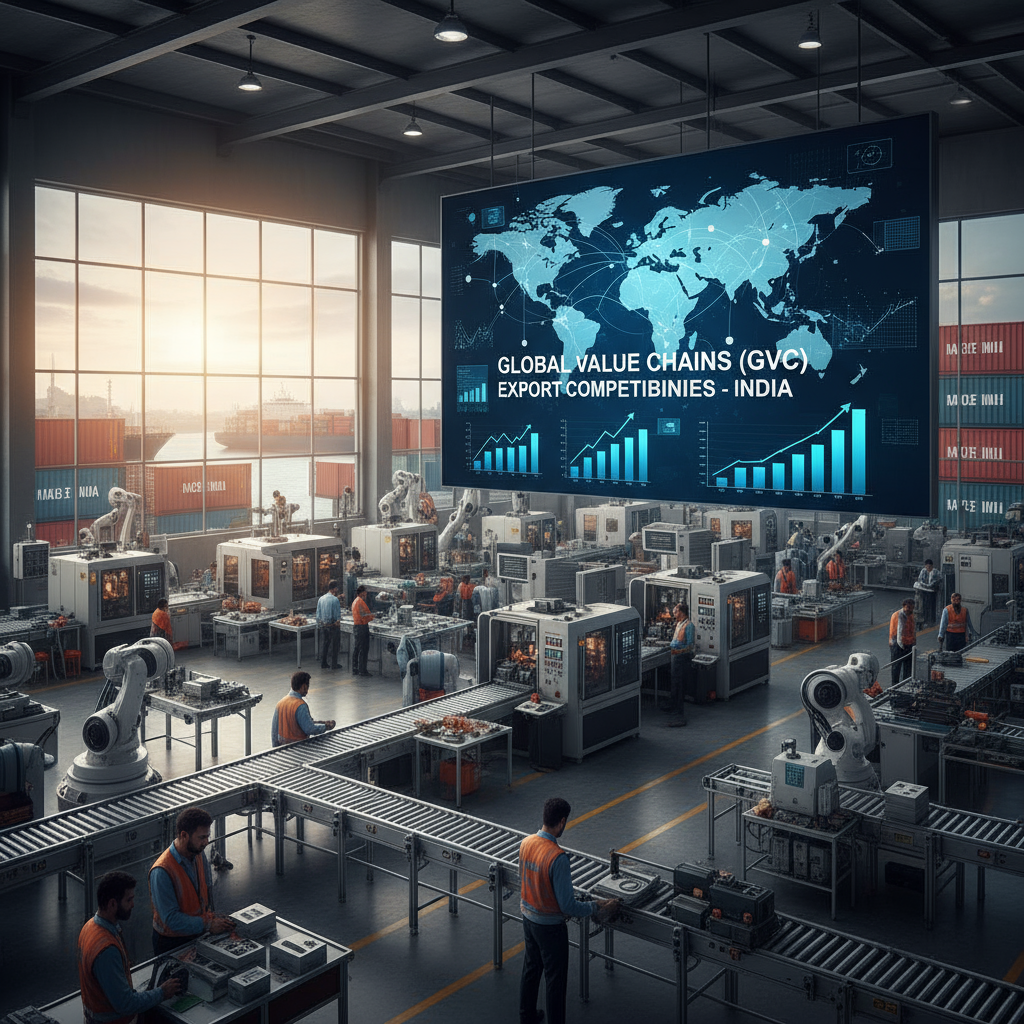
Despite relatively low GVC participation rate (around 41.3%), strategic infrastructure and policy reforms aim to boost backward and forward linkages, attracting lead firms and MSMEs into global supply chains.
Factor Market Impediments: The Cost Competitiveness Crisis
Labour Market Constraints: The Flexibility Challenge
Labour regulations create significant impediments to cost competitiveness and export growth:
Regulatory Bottlenecks:
- Tedious labour laws requiring government permission for retrenchment in firms with 100+ employees
- Four Labour Codes (2019-20) consolidating 29 laws remain unimplemented despite parliamentary approval
- Firms resorting to contractualization lacking long-term worker relationships and skill development
International Competitiveness Impact:
Rigid labour laws force Indian manufacturers to maintain higher employment levels than economically optimal, increasing per-unit costs and reducing price competitiveness in global markets.
Capital Market Challenges: The Interest Rate Disadvantage
Cost of capital affects production competitiveness and investment decisions:
Interest Rate Comparison:
- Real interest rates 2% higher than China on average since 2010
- Higher borrowing costs increase working capital expenses and project financing costs
- Credit access constraints for MSMEs despite banking sector recovery
Competitive Disadvantage: Higher capital costs make Indian manufacturing less attractive for investment compared to regional competitors with more favorable financing conditions.
Land Market Crisis: The Critical Priority Reform

Land availability and pricing represent the most critical factor market constraint:
Urban Land Crisis Metrics:
- Price-to-Income (PTI) ratio: 11 in urban India versus affordability benchmark of 5
- Expensive and unavailable land forcing firms to hinterland locations and multi-plant operations
- Dispersed growth model compromising world-class agglomeration economies
Agglomeration Disadvantage – China Comparison:
- Mumbai and Delhi population: 25-30 million (similar to Beijing and Shanghai: 20-25 million)
- Economic output disparity: Mumbai/Delhi GDP $100-150 billion versus Beijing/Shanghai $500-550 billion
McKinsey (2009) Research: Concentrated growth produces 20% higher per capita GDP than dispersed models, highlighting the massive opportunity cost of India’s constrained land markets.
Land Reforms: The Critical Imperative for Agglomeration
Impact on Corporate Strategy and Competitiveness
Land market constraints force sub-optimal corporate strategies:
Strategic Compromises:
- Multi-plant dispersion as workaround for land unavailability
- Loss of economies of scale and knowledge spillovers from clustering
- Higher logistics and coordination costs reducing global competitiveness
- Reduced innovation potential from limited industry clusters
Proposed Land Reform Solutions
Comprehensive land reform strategy requires systematic approach:
Supply-Side Reforms:
- Transparent release of developable land supply through credible land-use planning
- Government as largest landowner leading reform by example
- Increased supply and competition reducing prices and improving affordability
Regulatory Framework Improvements:
- Model Agricultural Land Leasing Act (2016) for enhanced agricultural productivity
- Land Acquisition Act 2013 requiring transparent and efficient implementation
- Urban planning reforms enabling higher density development
Union Budget 2024-25: Policy Framework Direction
Comprehensive Economic Policy Framework
Budget 2024-25 recognizes need for holistic approach addressing all factors of production:
Factor Market Focus:
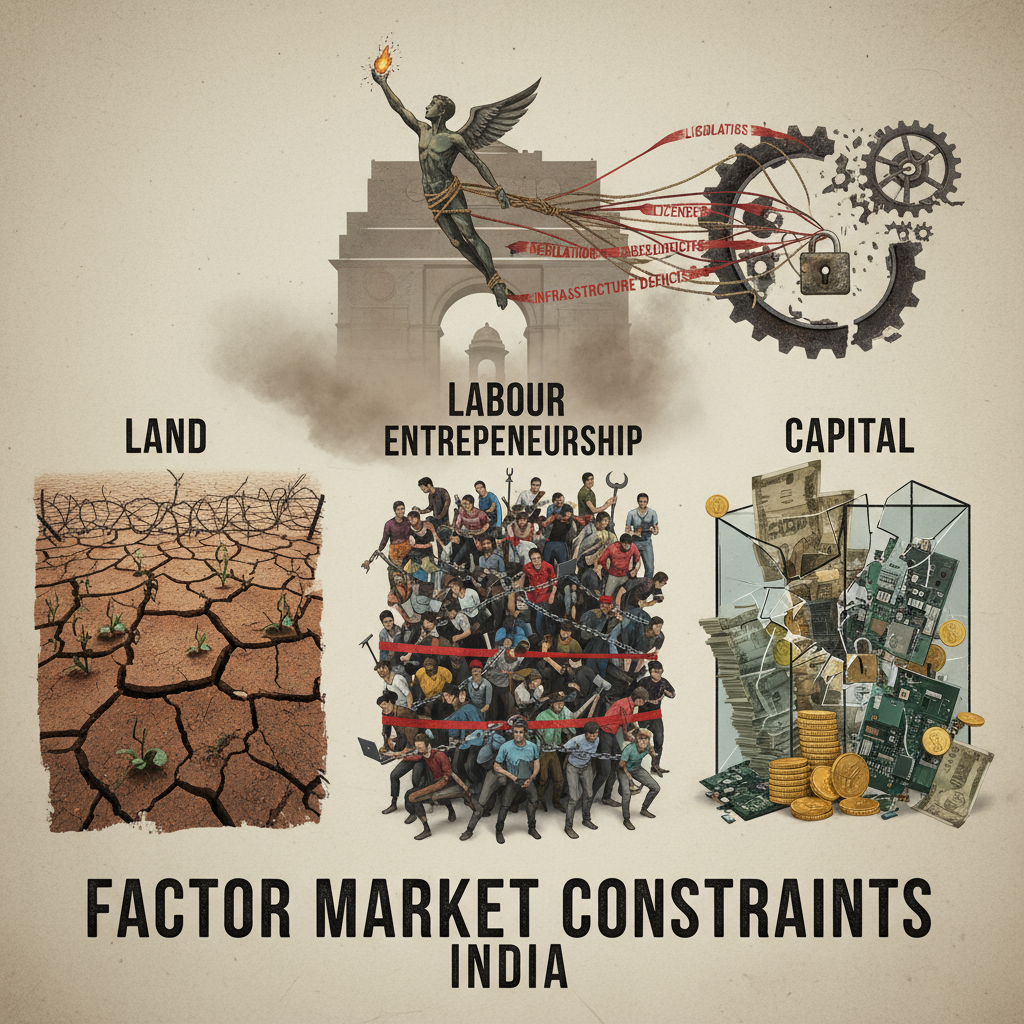
- Land, labour, capital, and entrepreneurship reforms for comprehensive competitiveness
- Technology as critical driver of total factor productivity and inequality reduction
- Recognition that factor market reforms are essential for competitiveness
Integrated Reform Strategy: Addressing individual factor constraints in isolation proves insufficient; success requires coordinated approach across all production factors.
Multidimensional Reform Strategy: Recommendations
Demand-Side Interventions
Short-term demand stimulation can create positive investment cycle:
Consumption Support:
- Expansion of social sector spending and rural employment schemes (MGNREGA)
- Targeted cash transfers stimulating household consumption
- Public investment in labour-intensive sectors (housing, MSMEs) creating ripple demand effects
Supply-Side Structural Reforms
Long-term competitiveness requires structural transformation:
Production Cost Reduction:
- Transparent land supply policies lowering establishment and expansion costs
- Implementation of pending labour code reforms enabling workforce flexibility
- Regulatory ease and tariff rationalization for GVC integration
Credit and Finance:
- Credit guarantee scheme expansion beyond MSMEs to mid-sized enterprises
- Alternative financing mechanisms reducing dependence on bank lending
Green and Digital Transition Support
Future-oriented reforms positioning India for next-generation growth:
Sustainability Integration:
- Green capex incentives for sustainable energy and circular economy adoption
- Linking PLI schemes to employment and innovation, not just output targets
- Investment in frontier technologies improving efficiency and productivity
Mission-Based Strategy:
- Linking industrial policy with national missions: energy transition, defence indigenization, digital infrastructure
- Encouraging niche product exports (UAVs, EV components, defence semiconductors)
- Positioning India competitively in emerging global sectors
Export Competitiveness Enhancement Framework
Leveraging Comparative Advantages
India possesses significant advantages that remain underutilized:
Factor Advantages:
- Low labour costs ($95 minimum wage versus $1550 in US)
- Skilled workforce in engineering and IT services
- Large domestic market for product testing and economies of scale
- Natural resource availability reducing raw material costs
Policy Support Measures:
- Production Linked Incentive (PLI) schemes attracting MNCs for domestic manufacturing
- Special Economic Zone (SEZ) policy reforms for MNC-led ecosystem development
- FDI liberalization: Regulatory Restrictiveness Index improved from 0.23 (1997) to 0.04 (2020)
Value Chain Integration Strategy
Specialization in production stages with comparative advantage:
Sector Focus:
- Manufacturing-intensive sectors: electronics, textiles, chemicals
- Value-added services: R&D, design, software development
- Component manufacturing for global assembly networks
Integration Benefits:
GVC participation enables technology transfer, skill development, and access to global markets without requiring complete domestic value chains.
Policy Recommendations for Enhanced Impact
Short-Term Measures (1-2 Years)
Immediate demand stimulation and confidence building:
Fiscal Expansion:
- Aggregate demand stimulation through targeted fiscal spending
- Credit support for private investment revival
- Accelerated infrastructure project approvals reducing implementation delays
Medium-Term Structural Reforms (3-5 Years)
Core structural constraints requiring systematic addressing:
Priority Reform Sequence:
- Land market reforms enabling agglomeration economies
- Labour code implementation with appropriate safeguards
- Financial sector deepening for alternative funding sources
Institutional Capacity Building:
- Implementation capability at central and state levels
- Coordination mechanisms across ministries and agencies
- Monitoring and evaluation frameworks for policy effectiveness
Long-Term Transformation (5-10 Years)
Fundamental economic structure evolution:
Human Capital Development:
- Education system alignment with industry requirements
- Skill development programs for emerging technologies
- Innovation ecosystem supporting R&D and entrepreneurship
Technology Adoption:
- Digital infrastructure enabling productivity improvements
- Industry 4.0 adoption across manufacturing sectors
- Green technology integration for sustainable competitiveness
Critical Success Factors and Implementation Challenges
Holistic Approach Requirements
Successful reform implementation requires comprehensive strategy:
Integrated Policy Design:
- Combining demand generation, structural reform, financial deepening, institutional trust
- Avoiding reliance solely on tax cuts and monetary easing
- Ensuring complementarity between different reform areas
Institutional Capacity and Coordination
Implementation success depends on institutional effectiveness:
Coordination Requirements:
- Inter-ministerial cooperation on cross-cutting reforms
- Centre-state coordination for concurrent subjects
- Public-private partnerships in reform design and implementation
Political Economy Considerations:
- Political will for difficult but necessary reforms
- Stakeholder consensus building through inclusive consultation
- Social acceptance through demonstrating inclusive growth benefits
Lessons from Global Best Practices
East Asian Development Model Insights
Successful economies demonstrate key reform principles:
Reform Sequencing:
- Concentrated urban growth maximizing agglomeration economies
- Export-oriented manufacturing driving sustained high growth
- Factor market flexibility enabling rapid structural transformation
Policy Coordination:
- Complementarity between different reform areas requiring coordinated approach
- Long-term vision with consistent policy implementation
- Adaptation to changing global conditions while maintaining reform momentum
Conclusion: Reviving the Investment Engine for Viksit Bharat
India’s investment revival stands central to achieving the Viksit Bharat @2047 aspirations, requiring fundamental transformation from current 30-32% gross capital formation to 35%+ levels that can sustain 8% growth trajectory. The corporate profitability paradox – where companies enjoy 7% profit margins but investment remains at 12% of GDP versus 16% peak – reveals that financial capability alone is insufficient for investment revival.
The twin challenge lies in understanding that corporate investment sluggishness represents a rational response to moderate growth outlook rather than a capability constraint. With current growth expectations at 6.5% versus 8% during surge years, Indian corporations are investing consistently with their demand growth assessment. The solution requires next-generation reforms that improve growth prospects and justify higher capacity investments.
Factor market impediments present the most critical constraints: Price-to-Income ratio of 11 versus affordability benchmark of 5 forces dispersed growth models that compromise agglomeration economies. Mumbai and Delhi’s economic output of $100-150 billion pales compared to Beijing and Shanghai’s $500-550 billion despite similar population sizes, demonstrating the massive opportunity cost of constrained land markets.
Export-led growth remains the only pathway to sustained 8%+ growth, but India’s 85% domestic revenue orientation versus South Korea’s 30% export share indicates substantial competitiveness gaps. The $2 trillion export target by 2030 requires fundamental shifts toward high-value, technology-intensive manufacturing and deeper Global Value Chain integration.
The reform blueprint must prioritize land markets as the critical imperative while simultaneously addressing labour flexibility, capital costs, and entrepreneurship constraints. Success depends on holistic strategy combining structural reforms, demand stimulation, human capital development, and macroeconomic stability rather than relying solely on financial sector interventions.
For UPSC aspirants and policymakers, this analysis demonstrates that sustainable investment revival requires understanding complex interactions between profitability, growth expectations, structural constraints, and global competitiveness. India’s demographic advantage and geopolitical repositioning offer unique opportunities for recalibrating the investment framework toward a resilient, inclusive, export-oriented economy.
The window for transformation remains open, but success demands political will for difficult reforms, institutional coordination across multiple agencies, and social consensus for changes that may create short-term disruptions for long-term benefits. The choice is clear: continue with incremental improvements that yield moderate growth, or embrace comprehensive reforms that unlock India’s true potential for becoming a developed nation by 2047.










+ There are no comments
Add yours