
Key Highlights
- Asia’s Pioneer: Kandla EPZ established March 1965 by PM Lal Bahadur Shastri – Asia’s first Export Processing Zone, converted to SEZ November 2000, now India’s largest multiproduct SEZ
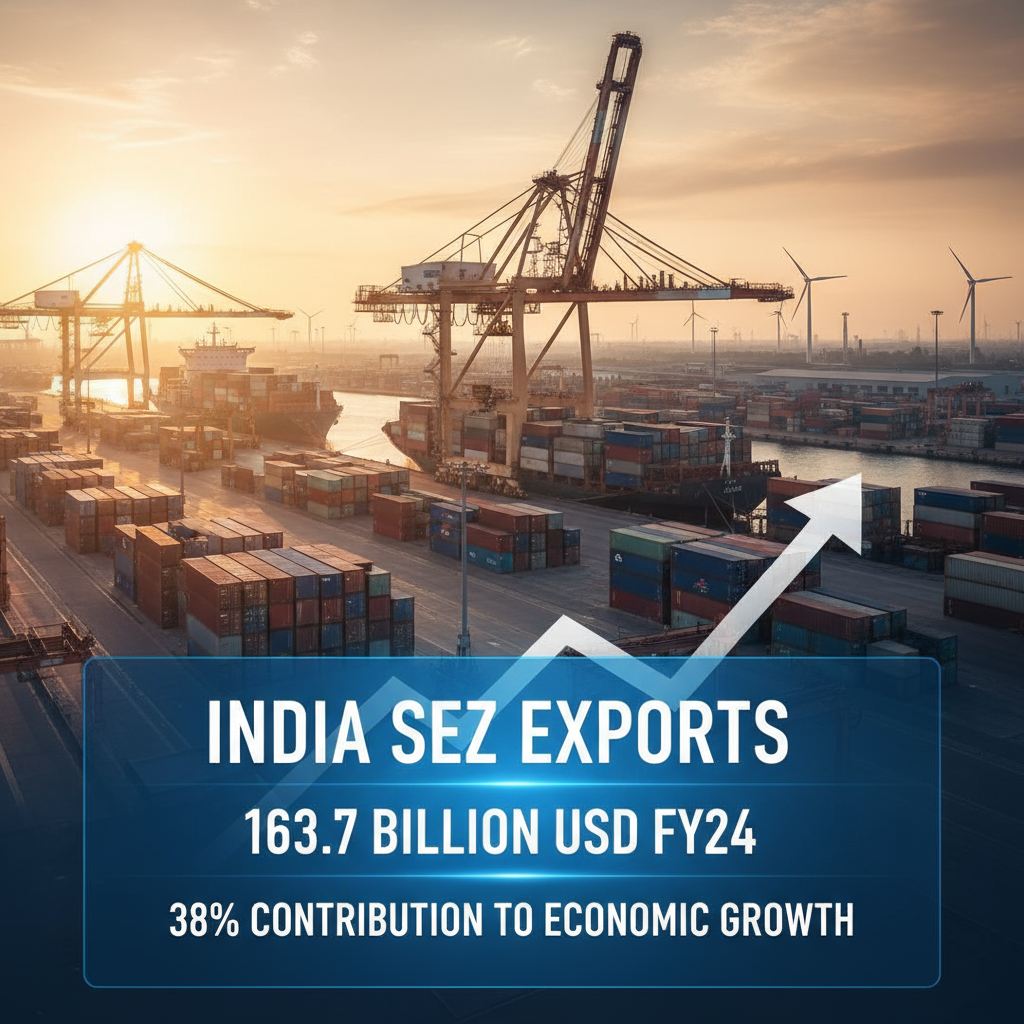
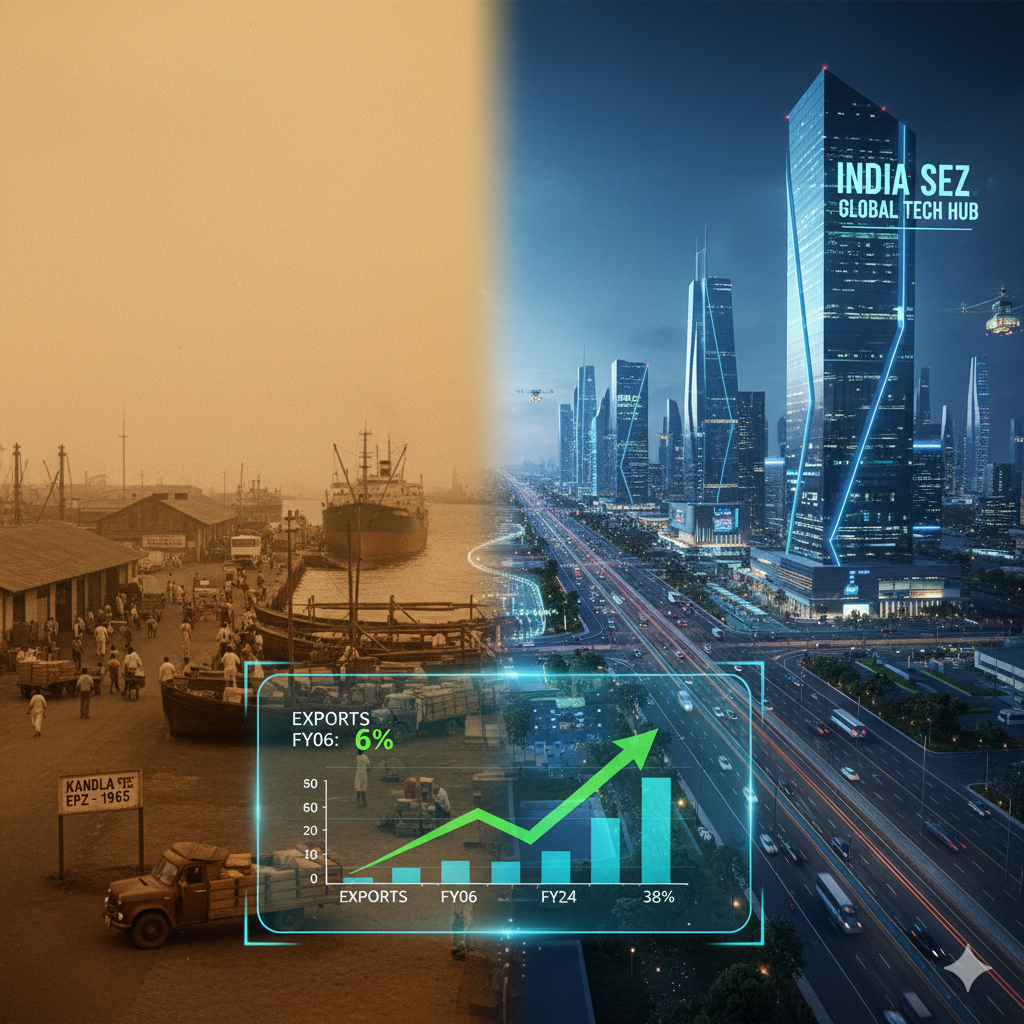
- Export Dominance: $163.7 billion SEZ exports in FY24 (38% of India’s $437B total); 6x growth from 6% (FY06) to 38% (FY24); 10% CAGR vs India’s 6%
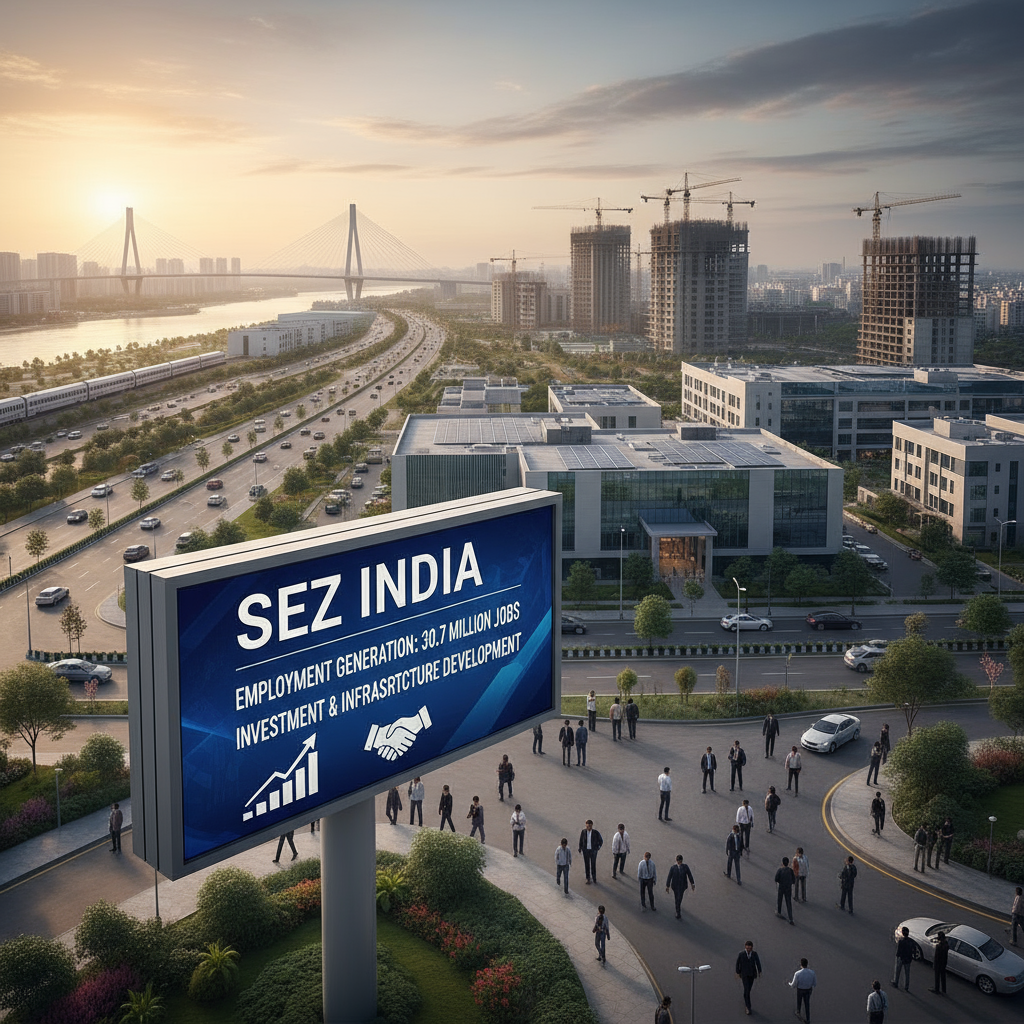
- Employment Giant: 30.7 lakh (3.07 million) employed in SEZs; 29.36 lakh incremental jobs created post-February 2006; ₹6.92 lakh crore cumulative investments
- Tax Incentives: Section 10AA offers 100% income tax exemption for 5 years, 50% for next 5, and 50% on reinvested profits for 5 more – total 15-year benefit period
- Operational Scale: 280 operational SEZs (out of 423 approved) as of March 2024 with 5,711 approved units; major destinations UAE, US, UK, Australia, Singapore
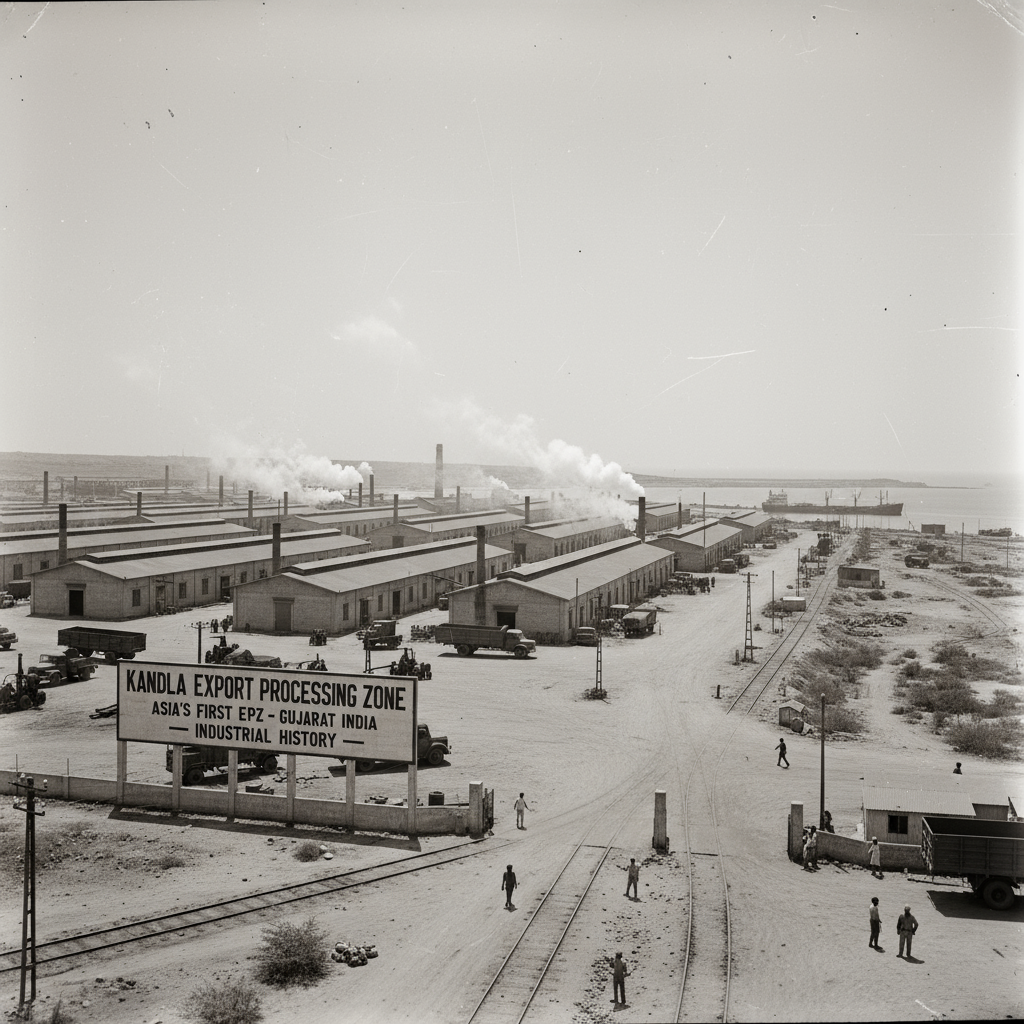
The Genesis: 1965 Kandla – Asia’s Export Revolution Begins
On a historic day in March 1965, Prime Minister Lal Bahadur Shastri inaugurated the Kandla Export Processing Zone in Gujarat – not just India’s first but Asia’s pioneering export enclave. Located in Kutch District near Deendayal Port (then Kandla Port), this 1,000-acre zone was established with three strategic objectives: kasez.gov
Earn Foreign Exchange: Generate hard currency through export-oriented production
Port Development: Contribute to Kandla Port’s growth and utilization
Employment Generation: Create quality jobs in a strategically important border region
The Kandla experiment proved instrumental in India’s industrial evolution – demonstrating that dedicated export zones with streamlined procedures could drive economic growth. This success led to seven more EPZs being established across India: SEEPZ Bombay (1970s), followed by Chennai, Noida, Cochin, Falta, and Vizag.
The EPZ Era (1965-2000): Promise and Limitations
While EPZs represented forward-thinking policy, their impact remained constrained by structural limitations:
Multiplicity of Controls: Numerous approvals and clearances slowed operations despite “export enclave” status
Infrastructure Deficits: Inadequate world-class facilities compared to competing East Asian export zones
Unstable Fiscal Regime: Frequent policy changes creating uncertainty for long-term investments
Limited Integration: EPZs functioned as isolated islands with minimal spillovers to surrounding economies
Scaling Challenges: Restrictive frameworks preventing achievement of critical mass needed for global competitiveness
By the 1990s, as India liberalized its economy, the limitations of the EPZ model became increasingly apparent against the backdrop of China’s Special Economic Zone success and export-led growth across East Asia.
The SEZ Revolution: 2000-2006 Policy Transformation
Recognizing EPZ shortcomings, India announced a comprehensive Special Economic Zones Policy in April 2000 under the Foreign Trade Policy framework. This aimed to create “engines for economic growth supported by quality infrastructure complemented by an attractive fiscal package” with minimum regulations.
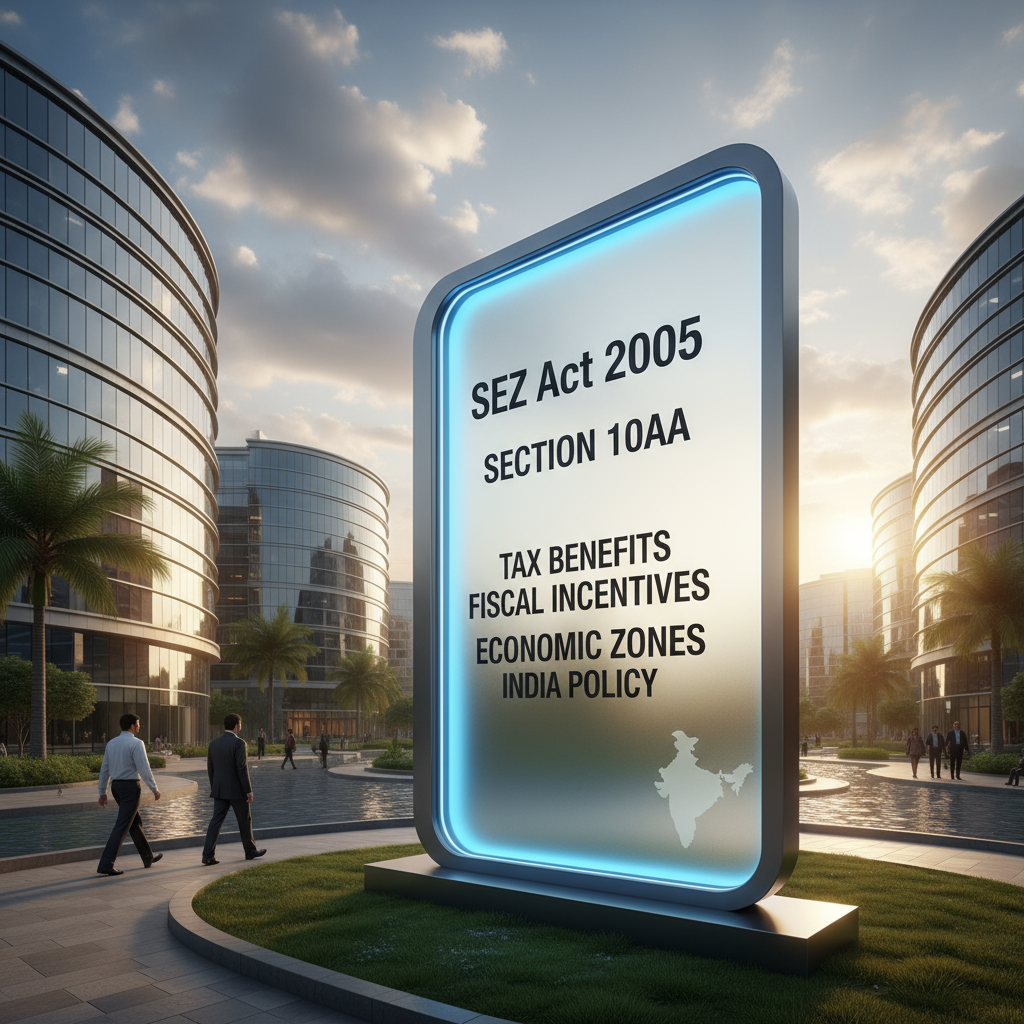
The SEZ Act, 2005: Legal Framework
To provide statutory backing, Parliament enacted the Special Economic Zones Act, 2005, which came into force on February 10, 2006. This legislation transformed SEZ from policy experiment to permanent legal framework with enforceable rights and obligations.
Duty-Free Status: SEZs treated as foreign territory for trade operations and customs duties
Import Freedom: No license required for imports; seamless procurement of capital goods and raw materials
Tax Exemptions: Multiple levies waived including excise duty, service tax, CST, and income tax benefits
Single-Window Clearance: Streamlined approvals reducing bureaucratic friction
Flexible Manufacturing/Services: Both production and service activities permitted unlike EPZ’s manufacturing focus
Section 10AA: The Tax Game-Changer
Perhaps the most attractive SEZ benefit is the income tax deduction under Section 10AA: indiafilings
Years 1-5: 100% deduction of export profits (completely tax-free)
Years 6-10: 50% deduction of export profits
Years 11-15: 50% deduction on profits reinvested in business development
- Unit must be in notified SEZ
- Commenced operations after April 1, 2006
- Engaged in manufacturing/production/services
- Earns income in convertible foreign exchange from exports
- Not formed by splitting/reconstructing existing business
- Cannot claim if already enjoyed Section 10A benefits for 10 years
Example Impact: If an SEZ unit earns ₹10 crore export profit in first year, the entire ₹10 crore is tax-free – zero income tax liability. From years 6-10, ₹5 crore would be exempt and ₹5 crore taxable. This creates massive cash flow advantages enabling reinvestment and competitiveness.
The Export Explosion: Numbers Tell the Story
The SEZ policy’s impact on India’s export performance has been nothing short of transformational: ibef
Export Growth Trajectory
FY 2005-06 (Pre-SEZ Act): Baseline period; SEZs contributed ~6% of India’s exports
FY 2017-18: $90.2 billion SEZ exports (30% of India’s total)
FY 2021-22: $133 billion SEZ exports
FY 2022-23: $157.24 billion SEZ exports
FY 2023-24: $163.7 billion SEZ exports – contributing 38% of India’s $437 billion total merchandise exports
Growth Rate Advantage
SEZ Export CAGR (FY18-FY24): 10% annual growth
India Overall Export CAGR: 6% annual growth
SEZ Growth Premium: 4 percentage points – outperforming national exports by 67%
Despite India’s overall exports declining 3.11% in FY24, SEZ exports grew 4% – demonstrating resilience and competitiveness of SEZ model even in challenging global trade environment.
The 6x Expansion Story
The most striking metric: SEZ share of India’s exports increased sixfold from ~6% in FY06 to 38% in FY24 – from marginal contributor to dominant export engine generating more than one-third of India’s total outbound shipments.
Employment and Investment: Economic Multipliers
Beyond exports, SEZs have emerged as major employment generators and investment magnets: ibef
Employment Creation
Total Employment: 30,70,653 persons as of December 31, 2023
Incremental Jobs: 29,35,949 jobs created post-February 2006 implementation
Employment Type: Mix of skilled, semi-skilled, and professional roles across manufacturing, IT/ITeS, services
Quality: Formal sector employment with better wages, social security, career growth compared to informal sector
Investment Attraction
Cumulative Investment: ₹6,92,000 crore ($82.79 billion) invested in SEZs as of December 2023
Foreign Direct Investment: SEZs providing stable regulatory framework attractive to multinational corporations
Infrastructure Development: Private investment-driven model (post-2005, central government hasn’t set up SEZs; all are private/state-driven)
Operational Infrastructure
Approved SEZs: 423 zones sanctioned by government
Operational SEZs: 280 zones functional as of March 31, 2024
Approved Units: 5,711 units within these zones as of December 31, 2023
Geographic Distribution: Clustering and Concentration
SEZ development shows significant geographic concentration in industrialized states:
Leading States:
- Karnataka: IT/ITeS SEZs around Bengaluru; electronics manufacturing
- Maharashtra: Financial services, IT, pharmaceuticals around Mumbai-Pune corridor
- Tamil Nadu: Automotive, electronics, textiles around Chennai
- Telangana: IT/ITeS boom around Hyderabad
- Andhra Pradesh: Multiple sectors including pharmaceuticals
- Gujarat: Textiles, chemicals, engineering goods; hosts historic Kandla SEZ
- Kerala, Uttar Pradesh: Emerging SEZ destinations
This concentration creates both advantages and challenges:
Advantages: Agglomeration economies, supplier ecosystems, skilled labor pools, infrastructure sharing
Challenges: Regional imbalances; less-developed states missing out on SEZ benefits; need for deliberate policy to spread SEZ advantages geographically
Export Destinations: Global Reach
SEZ products and services reach worldwide markets:
Top Destinations:
- United Arab Emirates: Re-export hub and consumption market
- United States: High-value goods, IT services, pharmaceuticals
- United Kingdom: Financial services, IT, manufactured goods
- Australia: IT services, manufactured products
- Singapore: Regional distribution hub
Sectoral Strengths:
- IT/ITeS: Software services, BPO, KPO exported globally
- Pharmaceuticals: Generic drugs, APIs, formulations
- Textiles & Apparel: Garments, home textiles
- Engineering Goods: Auto components, machinery, electronics
- Gems & Jewelry: Diamond cutting/polishing, jewelry manufacturing
Recent Policy Reforms: Adapting to Atmanirbhar Bharat
2025 amendments reflect SEZ policy’s evolution toward supporting domestic industrialization alongside exports:
Domestic Sales Liberalization
Historical Restriction: SEZ units prohibited from selling in domestic tariff area (DTA) or could only sell on paying full duties on finished goods
Reform: Units now permitted domestic sales on payment of duty foregone on inputs – encouraging value addition and reducing export-dependency rigidity
Rationale: Aligning SEZ framework with “Make in India” and “Atmanirbhar Bharat” enabling SEZ units to serve both export and domestic markets flexibly
Land Requirement Relaxation
Previous: 50 hectare minimum land requirement for SEZs
Reformed: Reduced to 10 hectares enabling smaller units and startups
Impact: Democratizing SEZ benefits beyond large corporate players to MSMEs and emerging enterprises
Semiconductor Integration
₹76,000 crore Semicon India Programme integrating with SEZ framework to build semiconductor manufacturing clusters with world-class infrastructure and fiscal incentives
Strategic Importance: Reducing import dependence on critical chips; building indigenous electronics ecosystem
Challenges and Criticisms
Despite successes, SEZ model faces persistent challenges:
Land Acquisition: Encumbrance-free land requirements slowing approvals; social displacement concerns in greenfield zones
Rent-Seeking: Proximity to policymakers sometimes fostering unproductive lobbying over productivity focus
Regional Inequality: Concentration in already-developed states widening inter-state disparities
Tax Revenue Loss: Income tax exemptions and duty waivers creating revenue forgone debate
Limited Backward Linkages: Some SEZs function as isolated enclaves without strong spillovers to local economies
Environmental Concerns: Rapid industrialization without adequate safeguards causing ecological stress
Conclusion: SEZ as Strategic Economic Tool
India’s 60-year SEZ journey from 1965 Kandla EPZ to 280 operational zones generating $163.7 billion exports (38% of national total) represents one of the world’s most successful export-led industrial policy experiments.
The numbers validate the model: 10% SEZ export CAGR versus 6% national average; sixfold export share expansion from 6% to 38%; 30.7 lakh employment; ₹6.92 lakh crore investments. SEZs decisively contributed to India’s global trade integration and manufacturing competitiveness.
The SEZ Act 2005 and Section 10AA tax benefits created predictable, attractive framework that transformed India from marginal player to major exporter in sectors like IT services, pharmaceuticals, automotive components, textiles. The 15-year tax holiday window enabled Indian firms to build scale and global competitiveness.
Recent policy evolution toward domestic sales flexibility, smaller land requirements, and semiconductor integration demonstrates SEZ adaptability to “Atmanirbhar Bharat” and “Make in India” strategic priorities beyond pure export orientation.
Challenges persist – geographic concentration, land issues, rent-seeking, regional inequalities – requiring continued policy refinement. Yet the fundamental SEZ value proposition remains strong: duty-free imports, tax exemptions, quality infrastructure, single-window clearances creating internationally competitive business environments.
SEZs exemplify how strategic industrial policy combining fiscal incentives, infrastructure investment, and regulatory streamlining can catalyze export growth, FDI attraction, employment generation, and technological upgrading. As India pursues $5 trillion economy ambitions, SEZs will remain critical pillars of manufacturing-led growth strategy.


+ There are no comments
Add yours